هذه المقالة غير متاحة بلغتك بعد. نعرض النسخة الإنجليزية.
Measuring savings honestly: baselines, seasonality and the Santa Ana lesson
A simple before/after average said ~3%; a season-blind method would have scored seasonality as savings. How a proper IPMVP Option C analysis reached ≈3–4%.
Hospital Santa Ana in Colombia is a 24/7 hospital where 83 Denka® plates were installed on 16 March 2022. Its data is a good lesson in how — and how not — to measure savings.
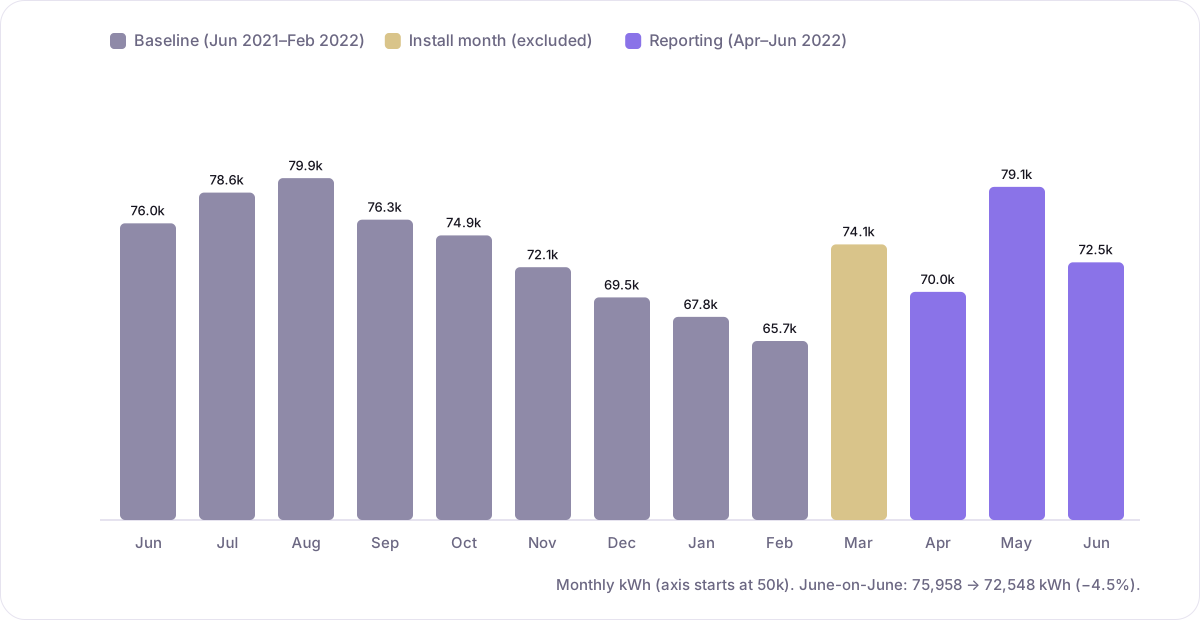 Monthly billing energy. Baseline Jun 2021–Feb 2022; installation month excluded; reporting Apr–Jun 2022.
The trap: season-blind comparisons
The baseline months run summer → winter; the reporting months run spring → early summer. Averaging a high-season baseline against spring months scores seasonality as savings — by that method, February 2022 (before any plates existed) already looked ~14% "below baseline".
The fix: model the season, anchor on like-for-like
- A facility seasonal model fitted to the nine baseline months: , CV(RMSE) = 1.9%.
- Two season-controlled anchors that need no model:
- March, two weeks either side of installation: −3.6%
- June 2021 vs June 2022: −4.5% (75,958 → 72,548 kWh)
Conclusion: an estimated reduction of ≈3–4%, reported as tentative because only three post-installation months were available.
What we take from it
- Normalise for what drives consumption — production, weather or occupancy.
- Prefer same-season comparisons when data is short.
- Report modest results as they are. A credible 3–4% is worth more than an inflated 9%.